Phuse US Connect 2022 Abstract – Accepted for Presentation
Currently, the statistical analysis outputs are validated manually by SAS programmers and biostatisticians. There are two main reasons for that:
- The process of generating and validating statistical analysis outputs is not standardised. Specifications and definitions are written in ‘Word’ documents and ‘Excel’ files.
- The outputs of the statistical analysis are static and considered flat files (PDFs, RTFs, HTMLs, etc.). Metadata is missing, and the information regarding the data hierarchy within and between the outputs does not exist. The files are made for human review, not for software analysis.
In order to develop any type of automation, an automated solution for converting static files into machine readable formats, should be developed.
To achieve that, we must follow these steps:
- Parsing: converting raw files into an abstract structure.
- Utilizing information contained in the files, such as abbreviations, clinical terms, synonyms, etc.
- Classification of headers identifies column and row headers automatically.
- Cells characteristics: adding the metadata information to each cell.
As a result, the information of every cell resides in a structure database, and we can finally benefit from it.
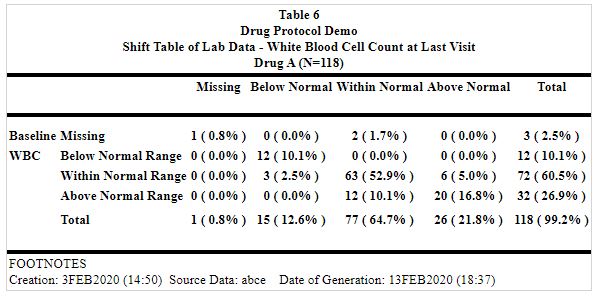
Table mining process example: There is no information about the cells in the static output.
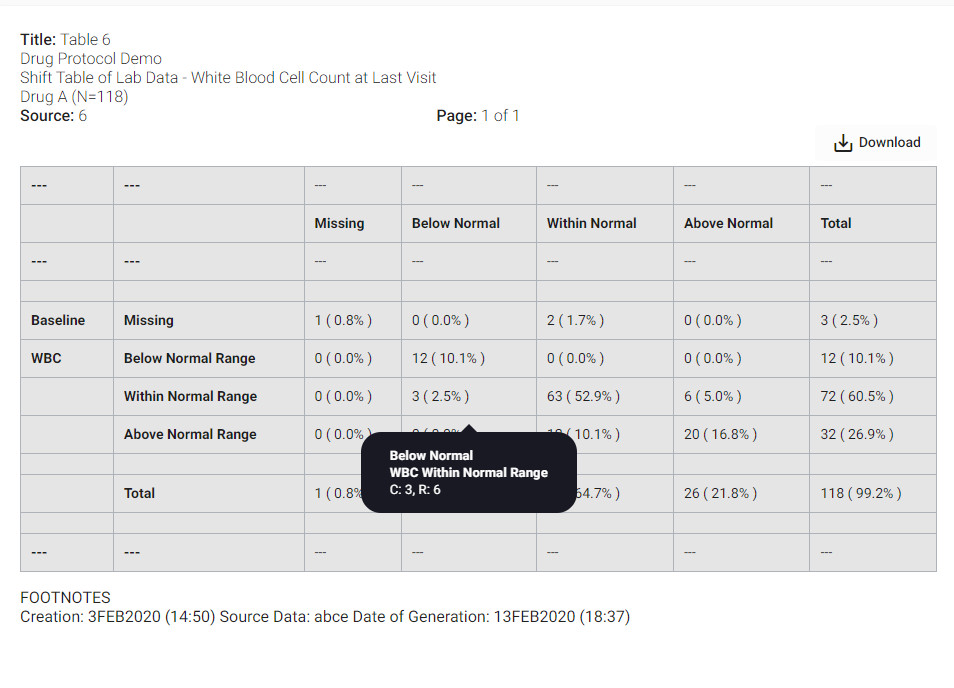
The examples below show how the software automatically identifies the hierarchy of cells.
Static Output
Post Table Mining Process
In our presentation we will describe the challenges and the implications of implementing such a process.