Background
Pharma companies and CROs have multiple studies going on at any given time. Study data needs to be validated if it is to serve as the basis for clinical analysis and provide support for conclusions reached by researchers.
One clinical study alone can contain hundreds of tables, with thousands of values. These tables are created from study datasets and must be validated by statistical programmers, who apply a series of checks defined by the pharma company.
Challenges
The validation process for a clinical study is time-consuming, complex and completed manually. The challenges faced by biometrics teams (statisticians and programmers) in providing high-quality data in a short amount of time create a major concern in the life science industry.
Today, the industry standard is to use an Excel spreadsheet. This may be effective in presenting data discrepancies as a figure, but it does not provide the context of each anomaly. Given the full context, the programmer would be able to understand the source of each discrepancy and eliminate it faster.
We identified three challenges that can be easily resolved with visualization of the validation process:
- Project (clinical study) tracking
- Discrepancy tracking
- Concurrent work due to version misalignments
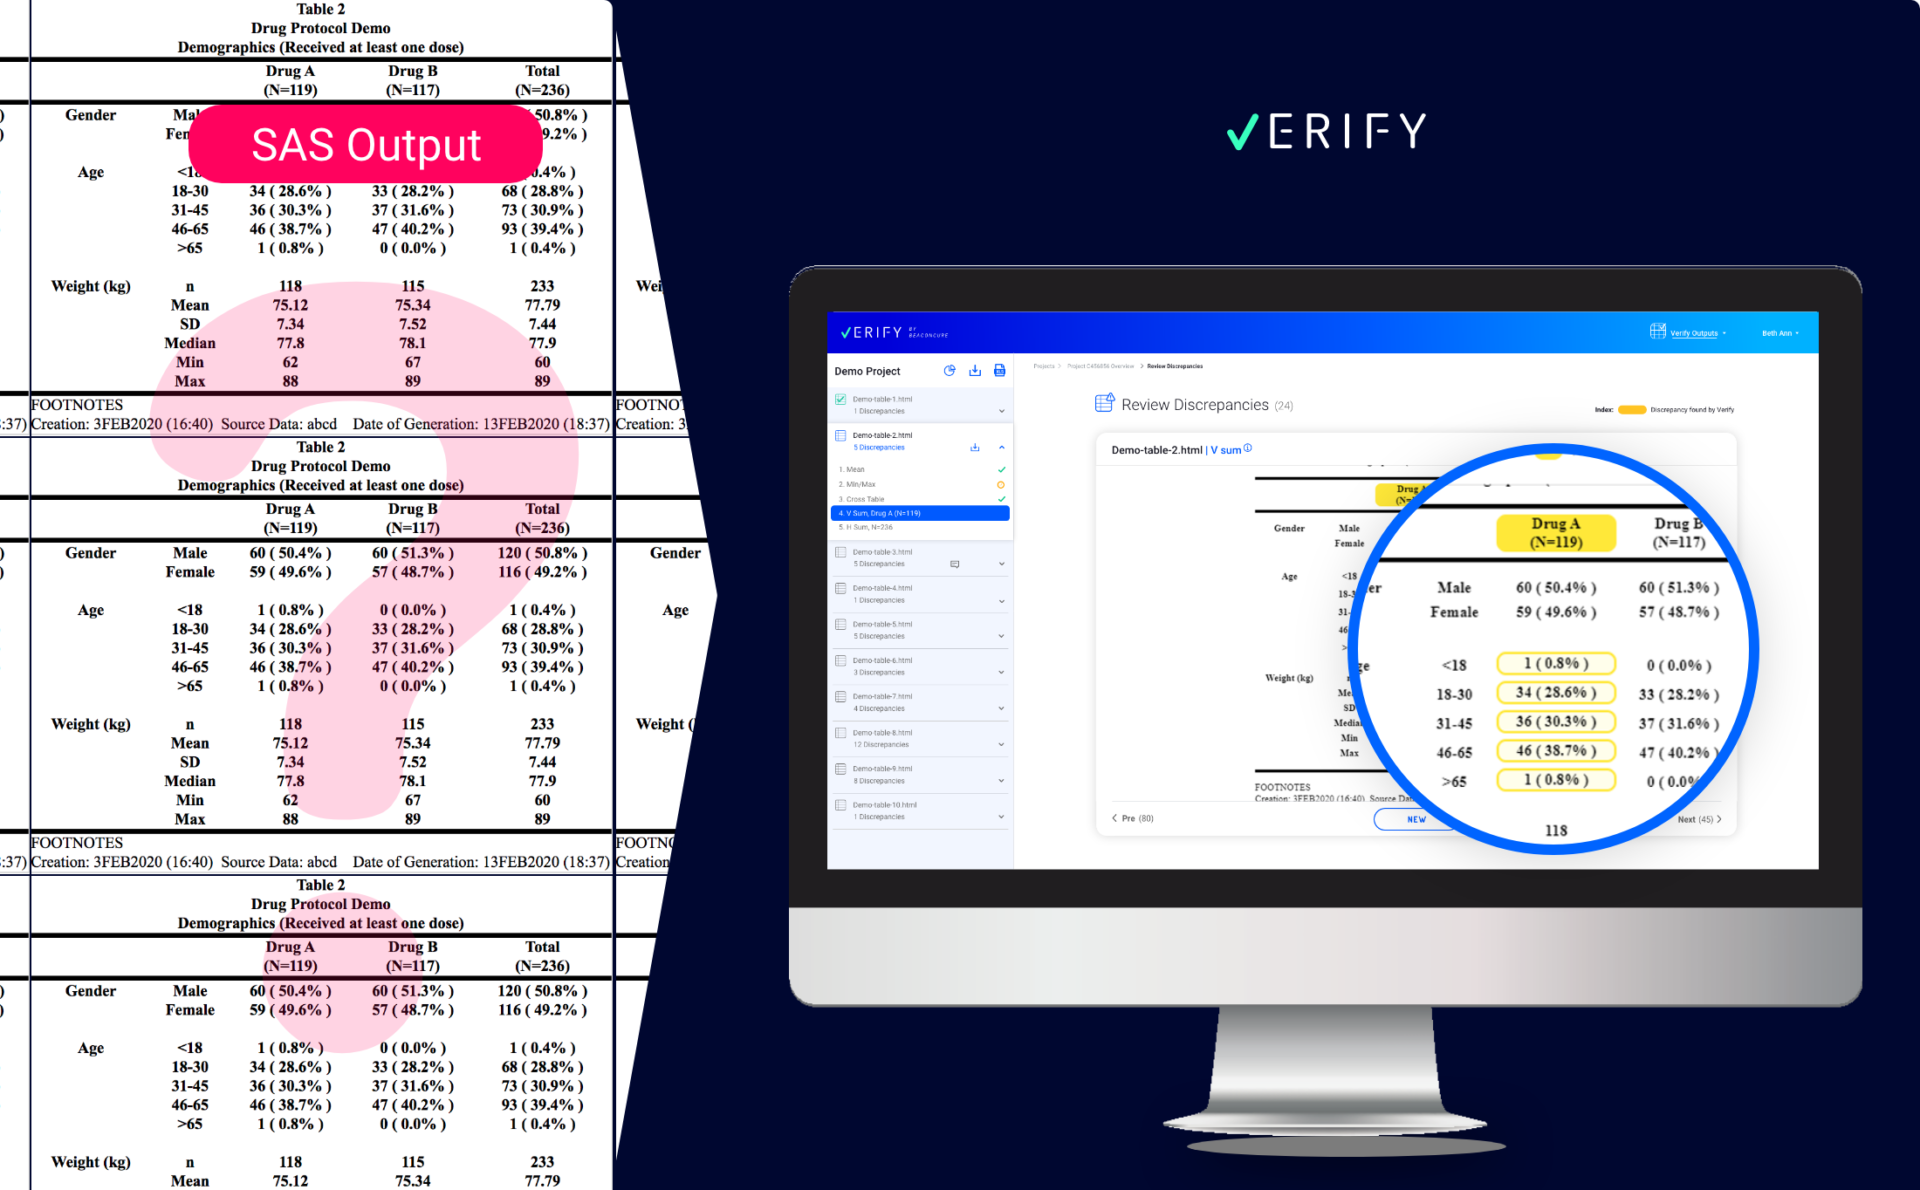
SAS OUTPUT VS. VERIFY VISUALIZATION
Solution
Verify, an automated solution leveraging Machine Learning, was designed to support regulatory submissions in drug and vaccine development.
Customers around the globe use Verify as part of their validation processes, in order to increase data quality and shorten time for submission. With the power of automation, the use of Verify has been expanded to all therapeutic areas and across the range of study phases (I, II, III).
We at Beaconcure are constantly adding data visualization features to Verify, helping to make the clinical data validation process easier, more accurate, and faster.
Verify also allows the user to better understand and track all their projects (studies) over time, and to facilitate concurrent work by as many colleagues as necessary.
Our data visualization and product teams developed an upgraded version of Verify that includes the following capabilities:
- A ‘Projects’ summary page
- ‘Project Overview’
- Discrepancy visualization
- Resolution status
The ‘Projects’ Page: Everything at a Glance
With our improved ‘Projects’ page, the user can see the status of each of their projects.
- Project Names
- Project Owners
- Number of ‘Uploaded Files’ in the project (a file includes one or more tables)
- File Status – showing the breakdown of the files as follows:
a. Defective (duplicate and corrupted files).
b. Suspected (files that contain data discrepancies).
c. Verified (files that are clean of discrepancies), with more detailed information in the tooltip.

‘Project Overview’ for the Bigger Picture
For a fast and focused understanding of each project’s status, we developed Project Overview. Here, the user can see the most important metrics regarding how many defects (duplicate and corrupted) and discrepancies were flagged in the files and segment the results according to type.
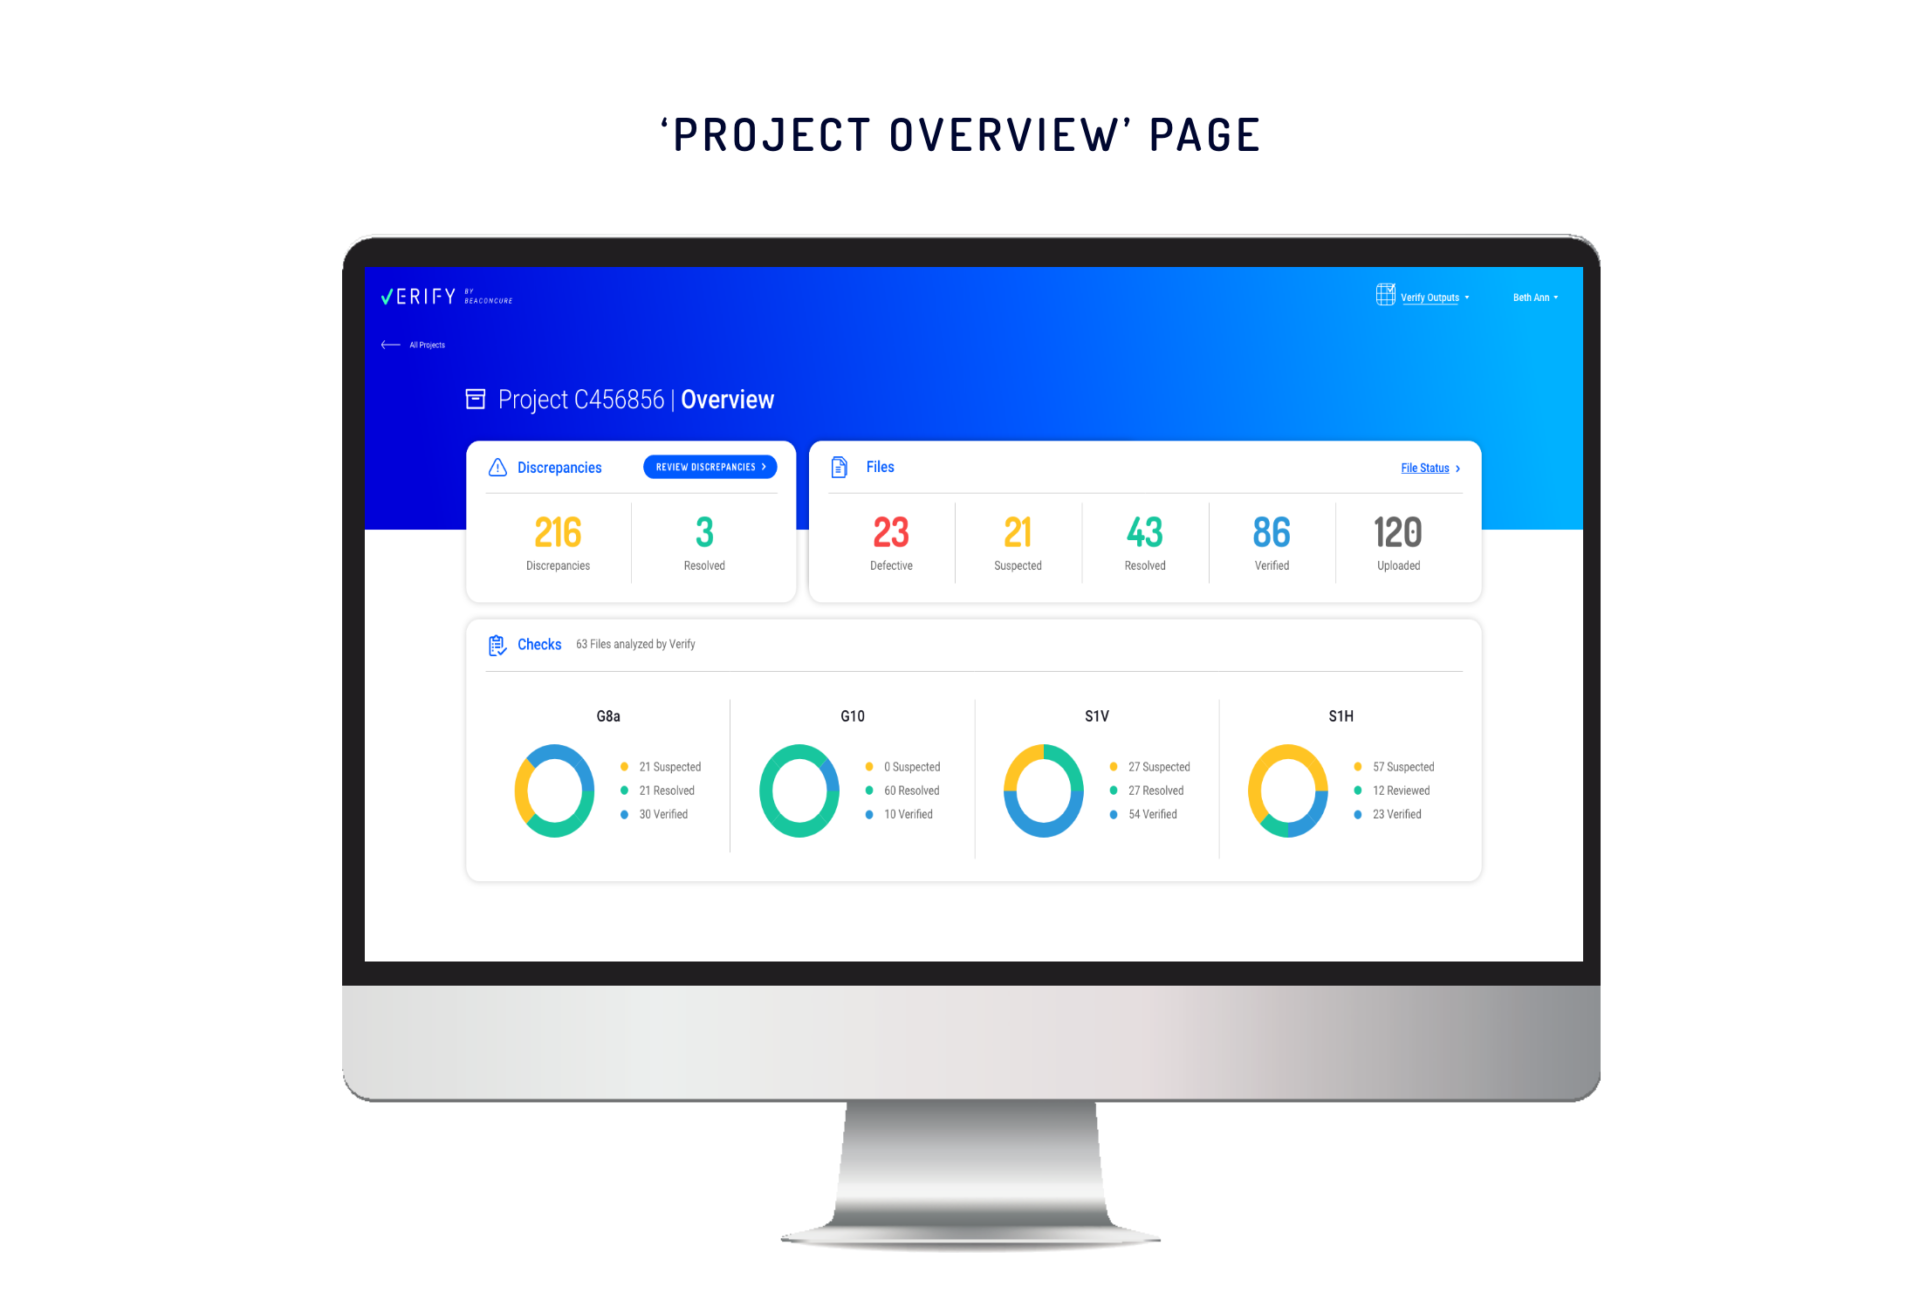
From the Overview page, the user can click on each type of discrepancy and get a full breakdown of its cause. In this way, the user can understand how the discrepancy can be addressed.
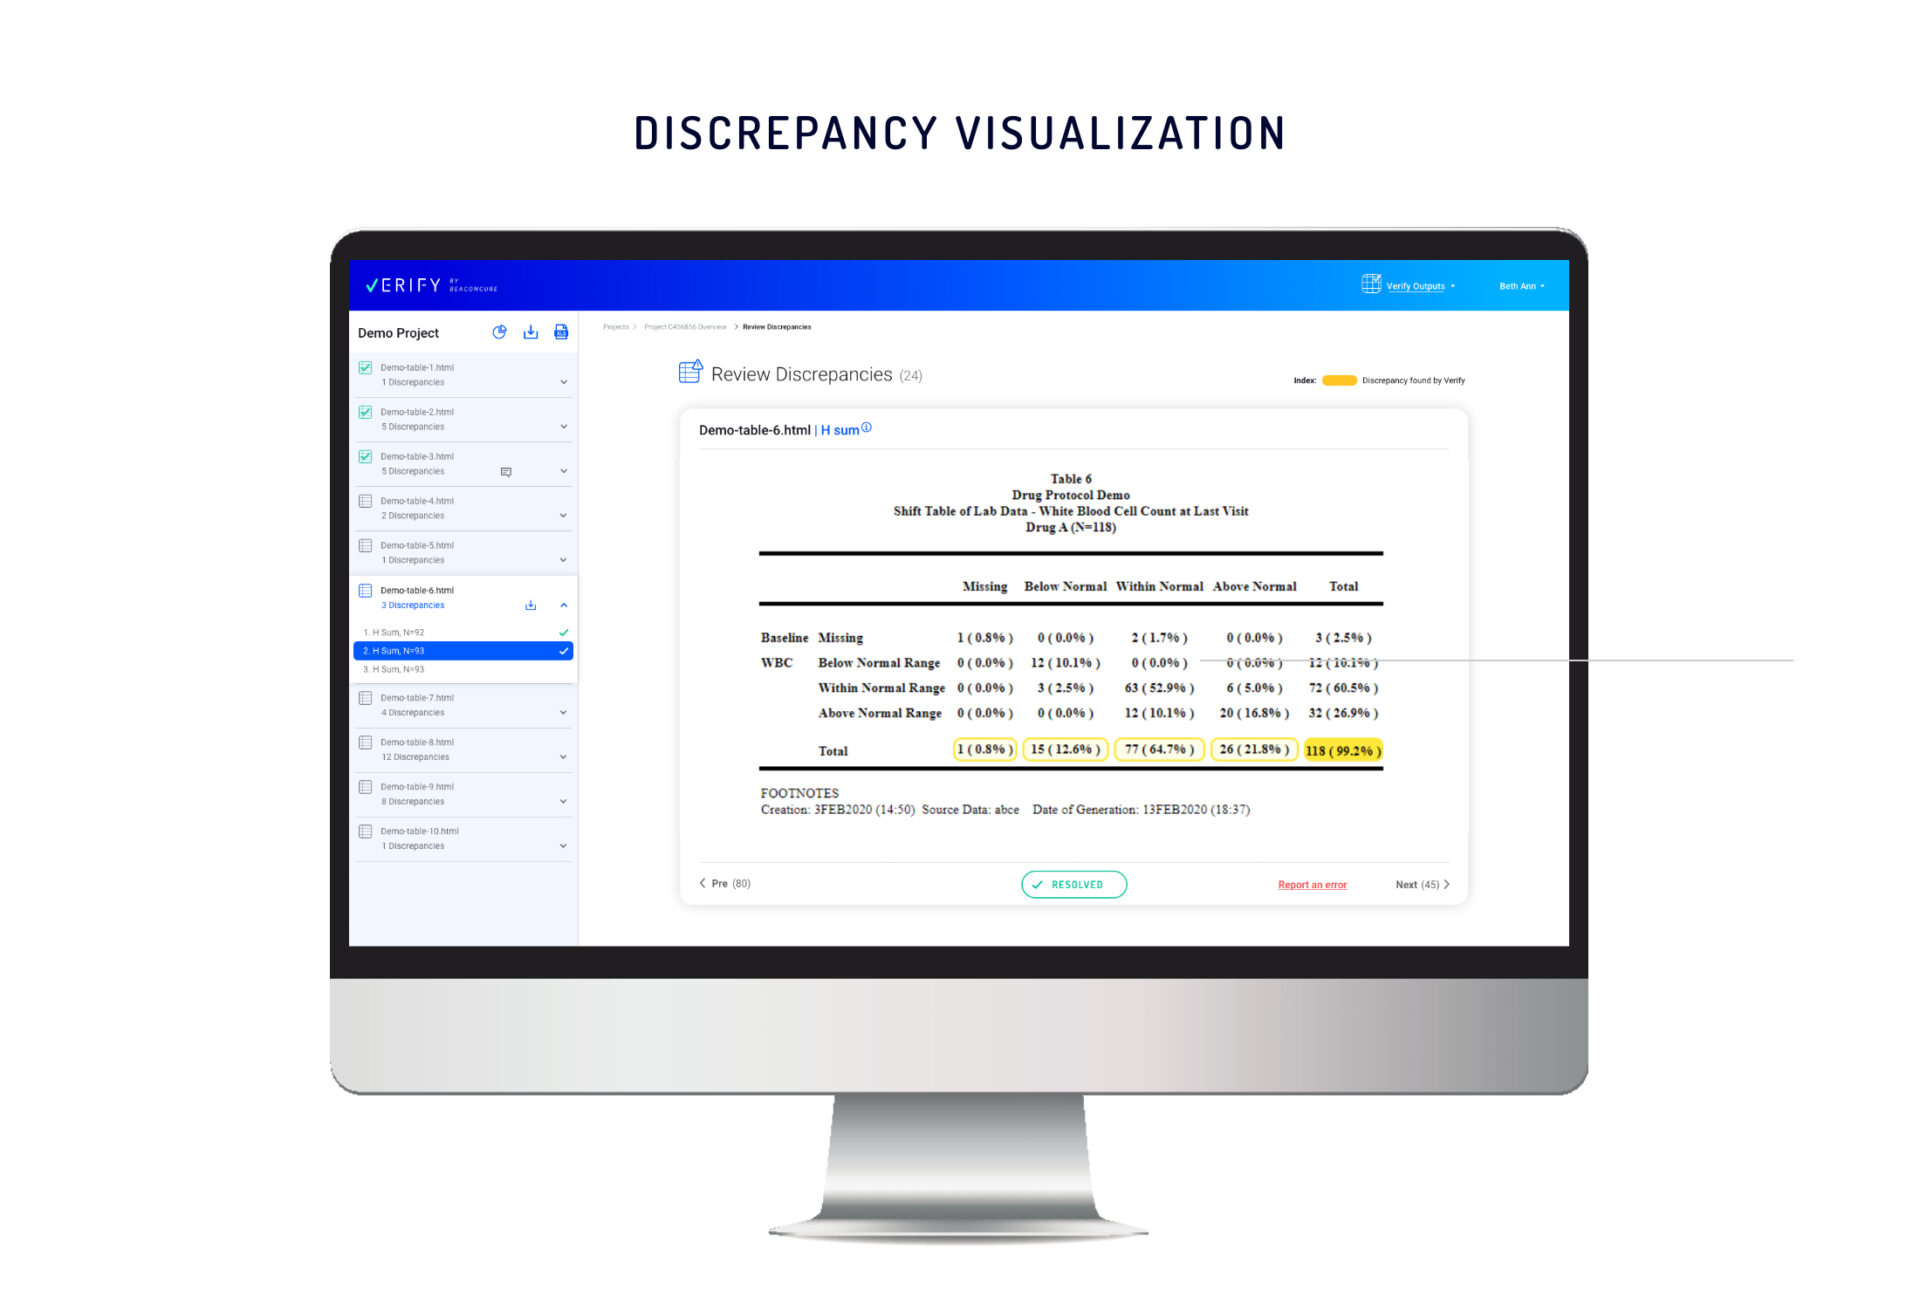
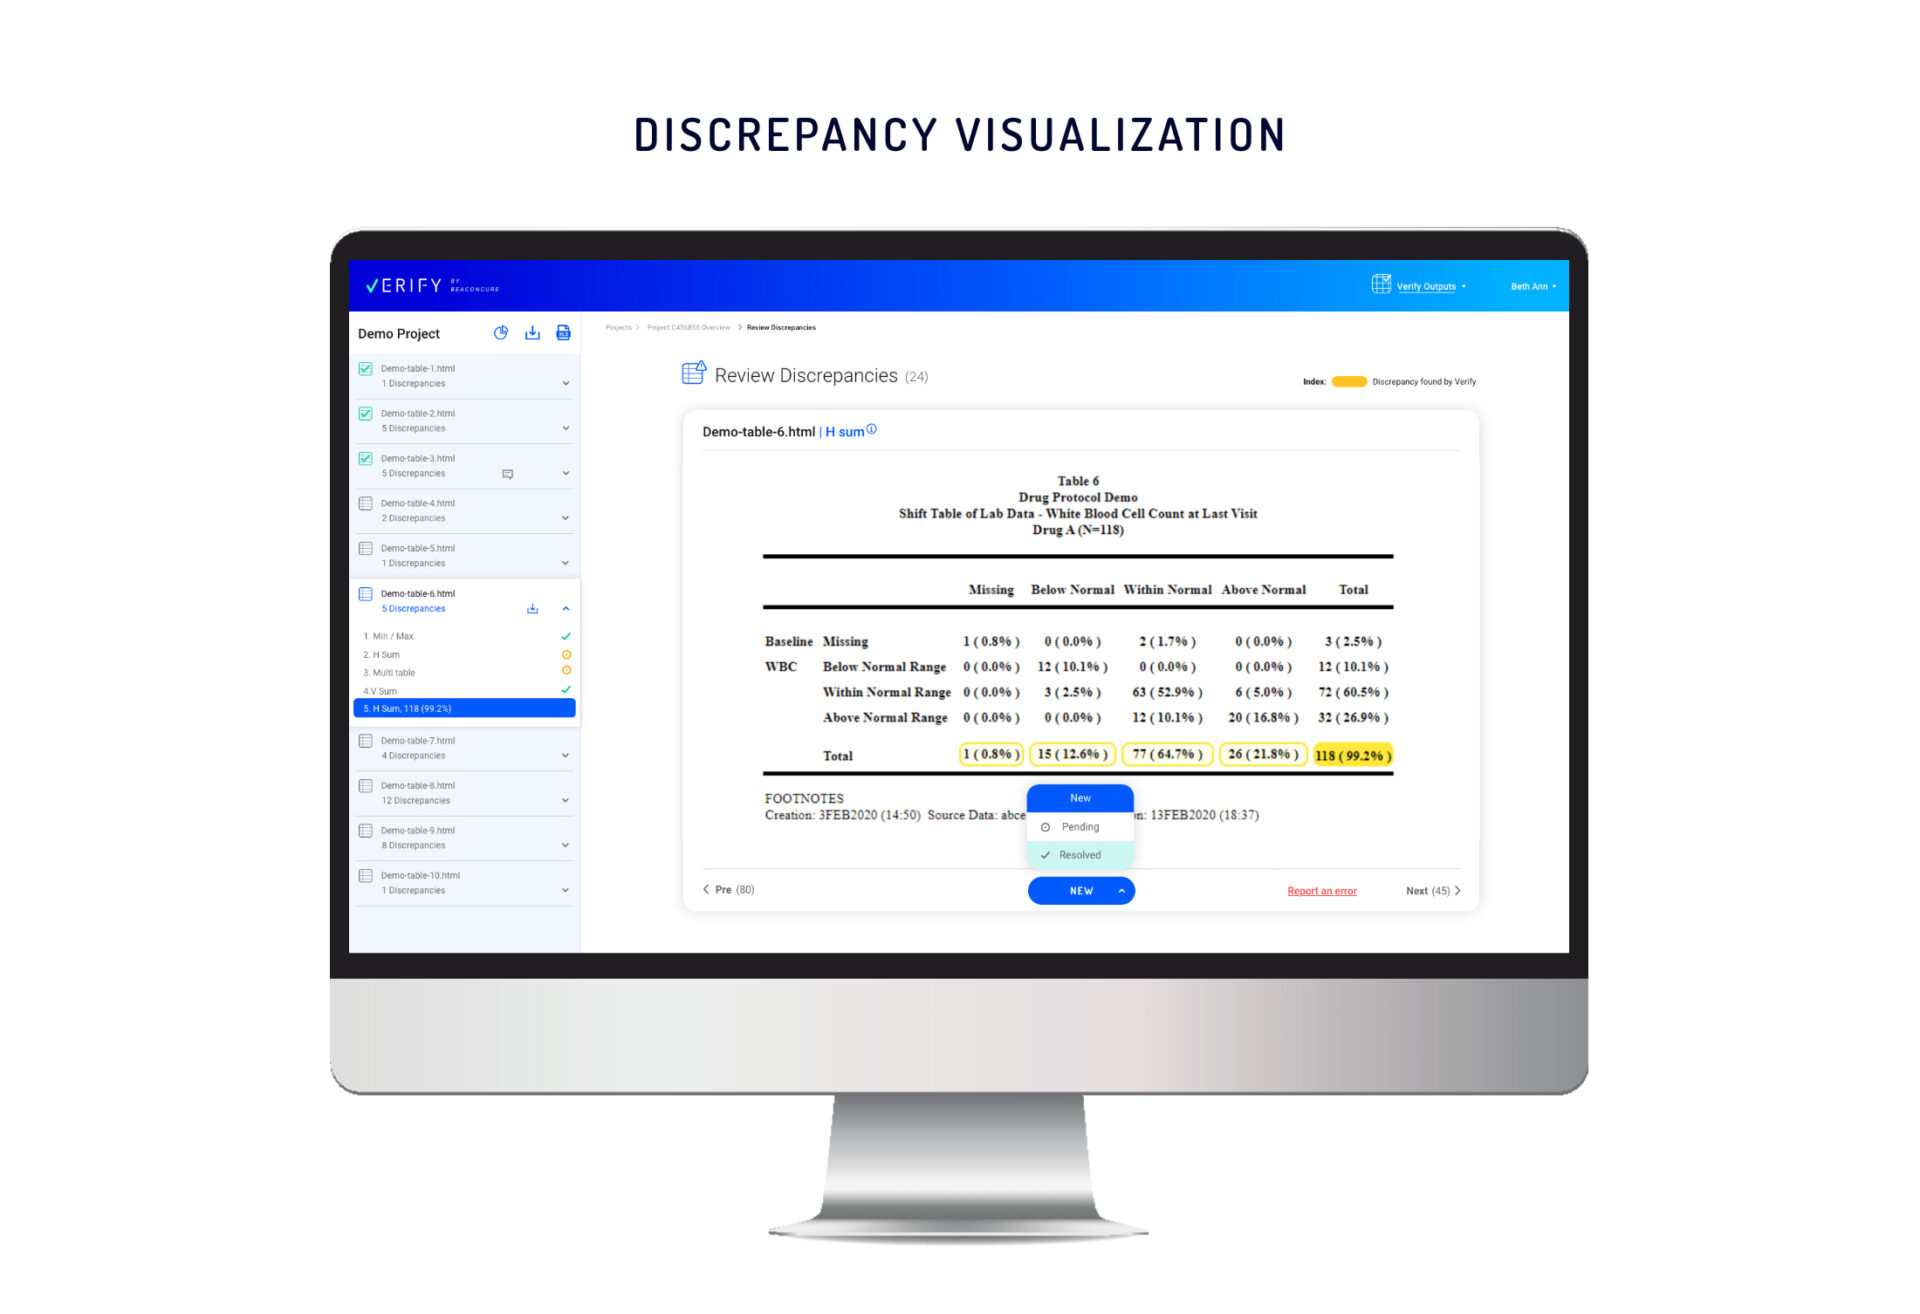
A New Way to View Discrepancies
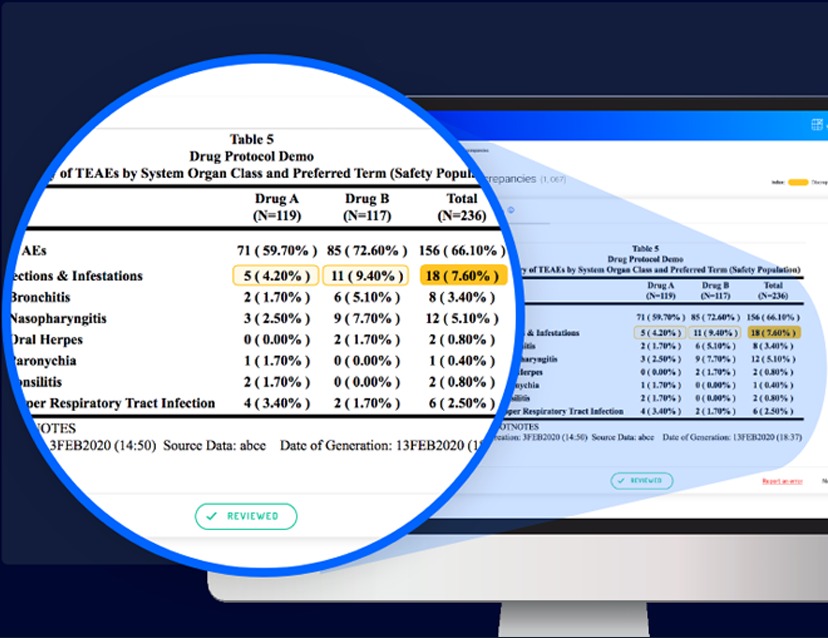
The Verify interface displays all the files and their discrepancies in a single view. Every set of study data uploaded to Verify, no matter how complex, is presented in a user-friendly manner, providing every stakeholder a quick overview of project status – from file to table to individual discrepancy.
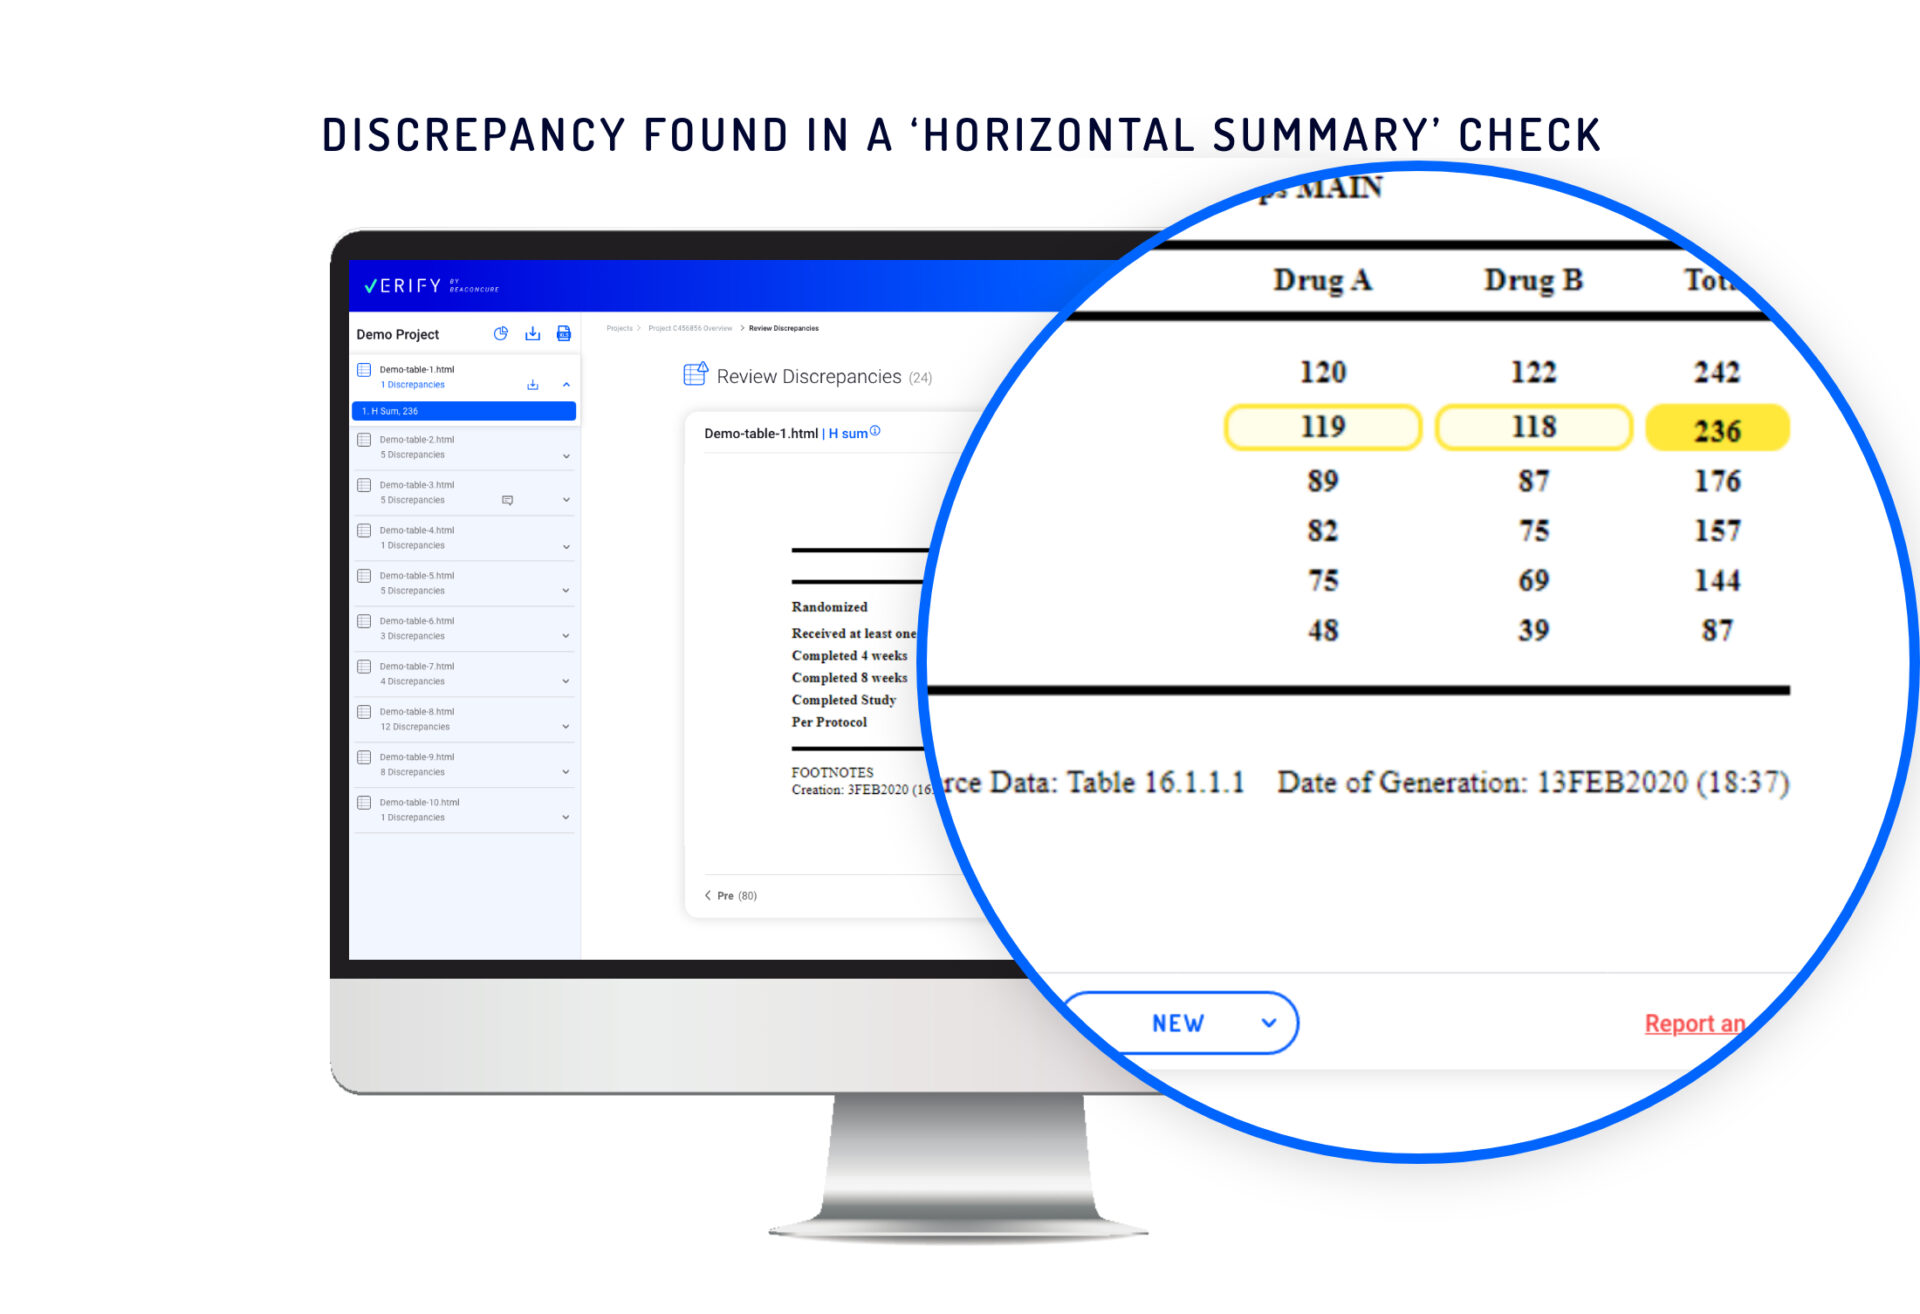
In the new Verify presentation, multiple discrepancies caused by different types of validation checks are flagged. Selecting a specific discrepancy will cause Verify to present the entire table, the context of the discrepancy, and the relevant cells.
Each discrepancy will be highlighted individually, indicating the type of checks applied to the data.
Some examples:
Horizontal summary check – Identifies discrepancies between the summary of cells in a single row and a ‘Total’ cell in the same row. In visually presenting this kind of discrepancy, Verify uses distinct highlighting to designate a few cells in the same row as “children” and one cell as the “parent”.
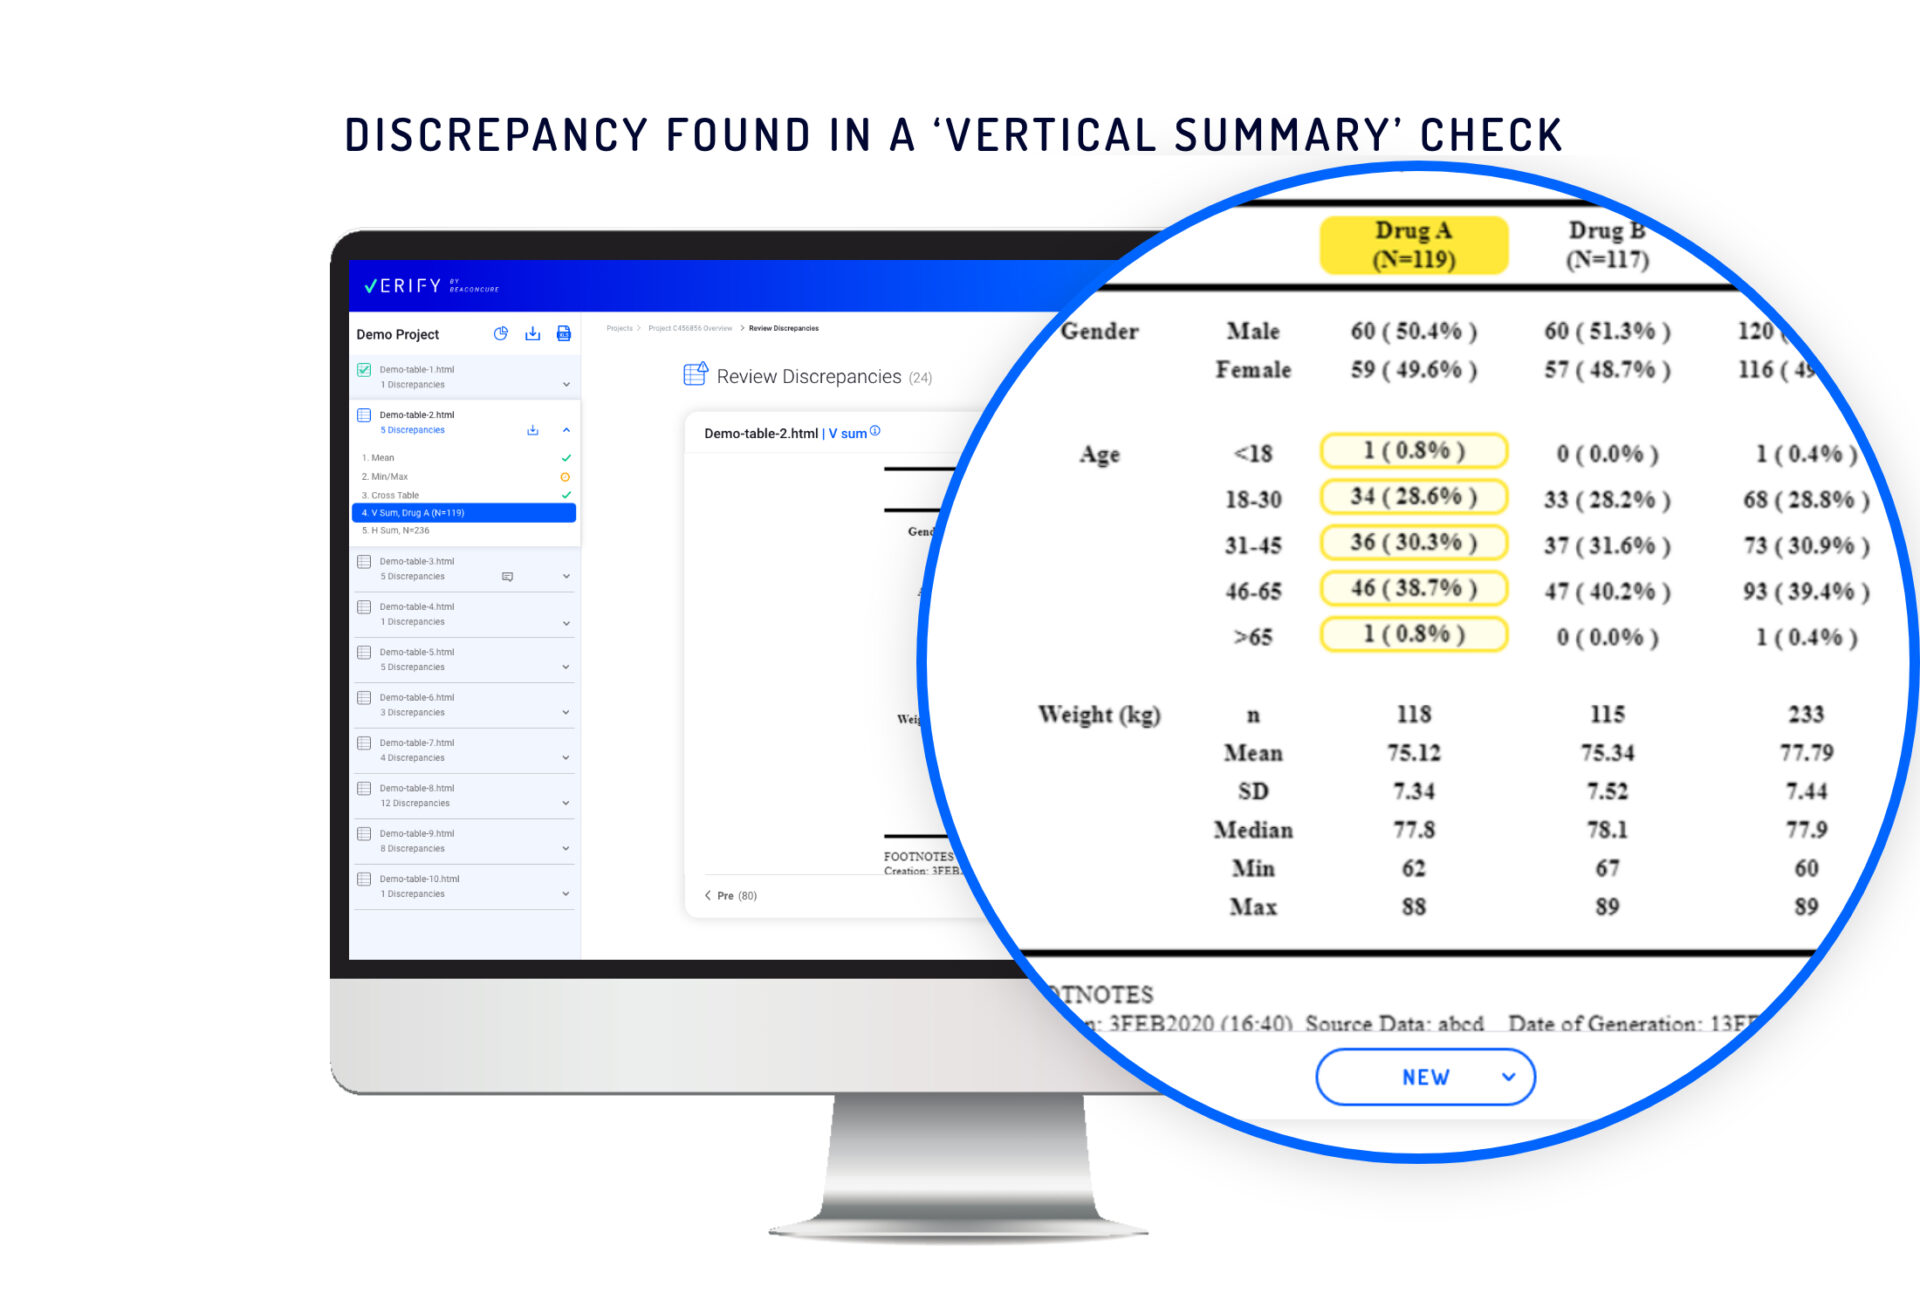
Vertical summary check – Identifies problems in sub-group summaries. In a single column containing discrepancies or errors, Verify designates the “children” cells and a “parent” cell.
More complex checks identify discrepancies between separate tables. In such cases, Verify displays the two tables side by side and highlights the table in which a discrepancy was found, allowing easy comparison.
Tracking and Collaboration
After Verify validation, resolving any issues that were revealed can take several
days. This might include identifying the source of the problem, sending emails to
relevant team members or researchers and waiting for replies. It is a challenge to
track progress for each of the discrepancies, but even more challenging to ensure
all collaborators are kept up to date.
However, Verify’s clear visualizations make it is easy to monitor and manage the
resolution process for each discrepancy. As progress is made, all team members
and managers have seamless access to the very latest updates.
Summary
By intelligently visualizing the validation process with Verify, discrepancies can be
more accurately and effectively identified, understood and tracked. Collaboration
becomes seamless and managing the resolution of multiple data issues is
streamlined. This revolutionary boost to efficiency means regulatory submission
timelines can be significantly shortened without compromising on data quality. As a
result, pharmaceutical companies and CROs can introduce drugs and vaccines to
patients worldwide as early as possible.